
Introduction
In today’s business climate, you’d be hard pressed to find an organization that does not talk about Diversity, Equity and Inclusion (DE&I) as a business priority, a goal, a value, a differentiator, a part of organizational culture, and, at the same time, a focused area for improvement. On the one hand, a focus on diversity, equity and inclusion is important for companies looking to build workplaces that are representative of the world in which we live. On the other hand, investments in diversity, equity and inclusion have a well-documented relationship to business performance and increased profits.
Diversity, equity and inclusion are more than buzzwords or corporate values to aspire to, and more than a means to heightened business results. At HireRoad, we see DE&I as a key cultural foundation for organizations. We believe this is a human rights conversation. And we believe Diversity, Equity and Inclusion should be a focus because it is the right thing to do.
One thing is clear from everything we have seen over the years and everything we are continuing to learn today – problems with Diversity, Equity, and Inclusion are often systemic in nature. They cannot be solved by one-off programs and policies. Organizations need a comprehensive approach that looks at diversity, equity and inclusion across the organization (and society) as a whole. HR may lead the effort, but this is an organization-wide undertaking. Data and analytics should play a key role in this endeavor, providing the ability to identify where there are gaps, prioritize areas for action, and enable ongoing measurement of progress.
A commitment to enhancing diversity, equity and inclusion efforts, will lead to increased belonging within the organization. Not only does a culture focused on belonging feel great, it is also a driver for employee engagement, productivity, corporate reputation, attracting top talent, and business results.
Let’s face it – there isn’t an area of your business that diversity, equity, inclusion – and ultimately belonging – does not affect. A focus here is essential to business success.
HireRoad (formerly PeopleInsight) Co-Founder, John Pensom, speaks about the role of HR analytics when it comes to diversity, inclusion, and belonging.
What Does the Research Say?
There has been a lot of research on the business outcomes that a focus on diversity, equity and inclusion can yield.
Bersin by Deloitte research has found that companies that embrace diversity and inclusion in all aspects of their business statistically outperform their peers. Bersin found that across 128 companies, those with talent practices focused on building a diverse and inclusive workplace, were ranked as high performing organizations, compared to those that did not focus on these areas.
Another study focused on gender diversity found that companies with women board members outperform companies with all male boards. In connection with this, a recent Glassdoor survey, cited in Harvard Business Review, found that top female candidates care about gender diversity at prospective companies. Their study shows that 61% of women look at the diversity of the employer’s leadership team when deciding where to work.
A McKinsey study found that earnings before interest and taxes (EBIT) increased by 8% for every 10% increase in the ethnic and gender composition of senior executive teams in the United States.
Research focused on business decision making shows that teams that are diverse and inclusive make better decisions than both individual decision makers and teams that are not diverse or inclusive. One study found that teams that are diverse and inclusive make decisions faster, with fewer meetings, and make better business decisions 87% of the time.
The data shows it and your heart knows it, diversity, equity and inclusion delivers results.
Diversity, Equity and Inclusion
This is the model we find useful when thinking about diversity, equity and inclusion in the workplace.
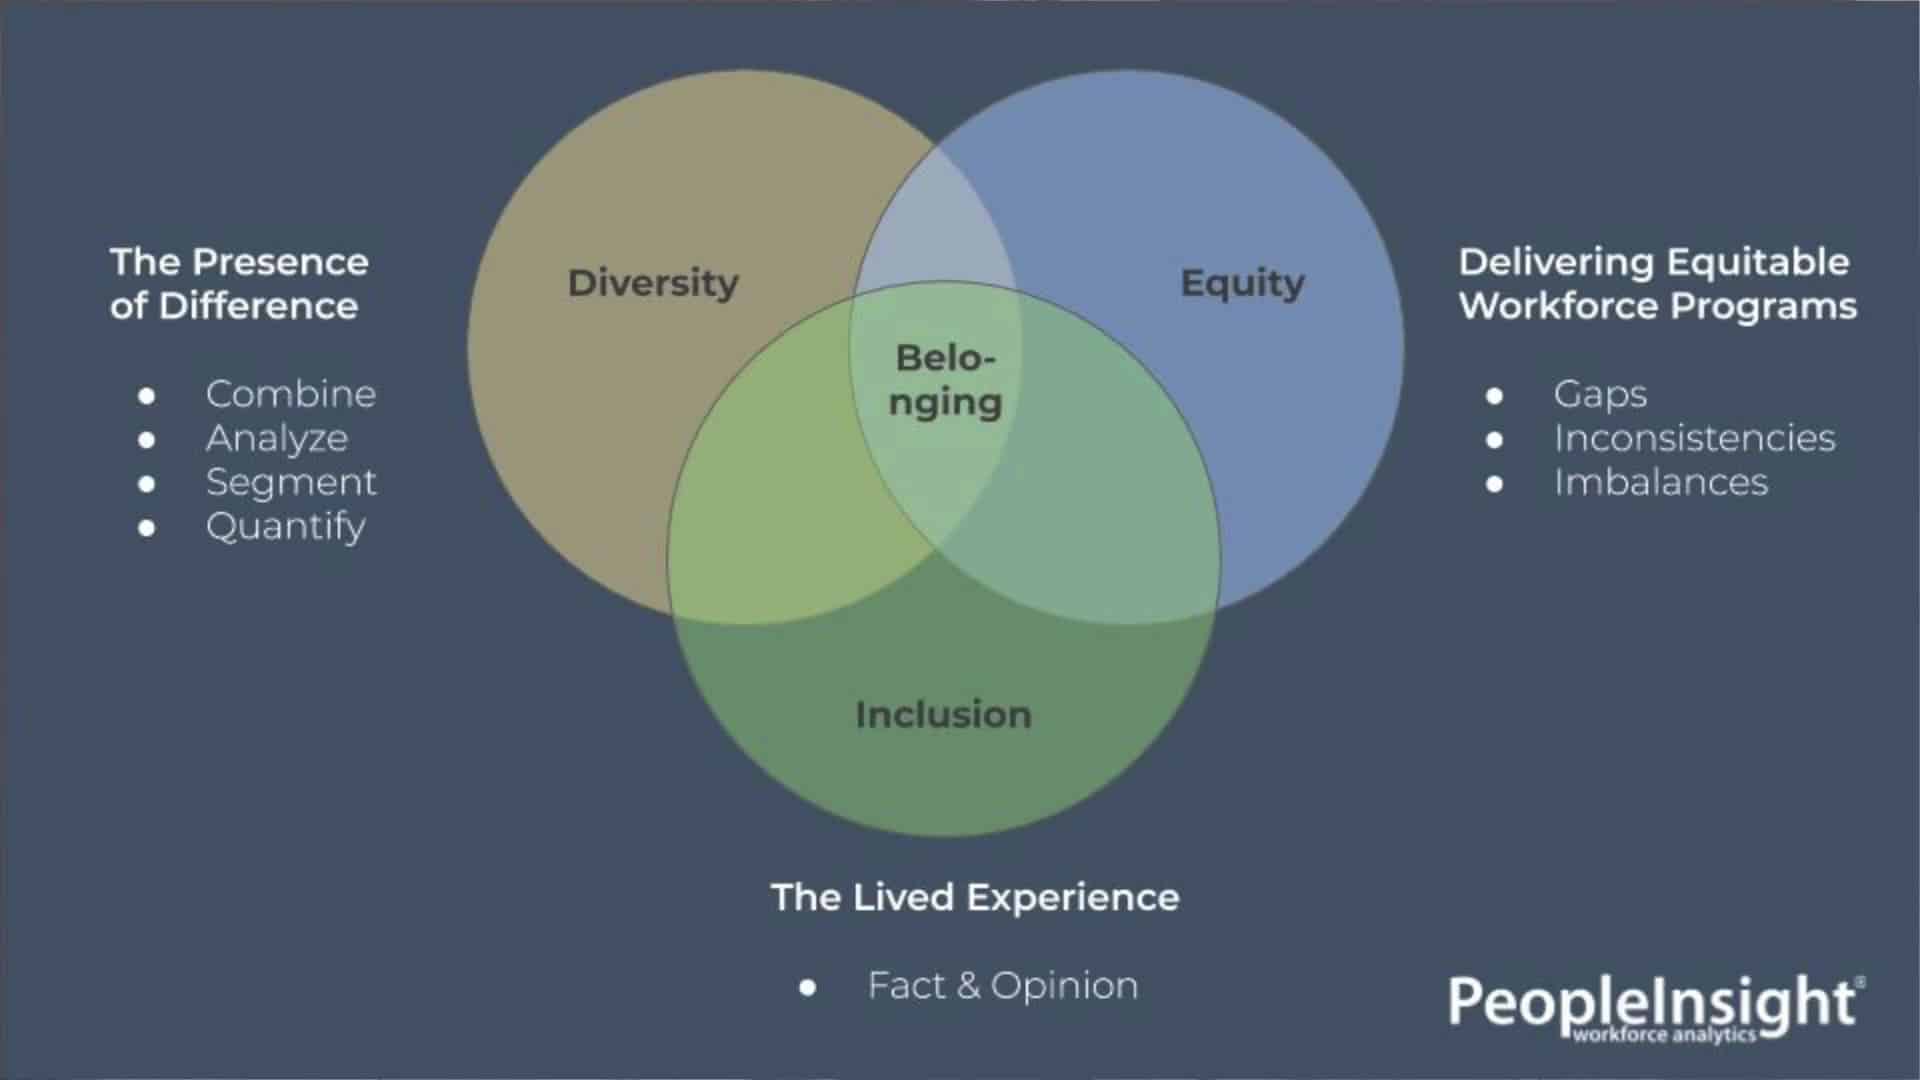
Diversity
Diversity can be described as the “presence of difference”. This can be across demographics, cultural origins, skills and abilities, attitudes, ideas and philosophies, beliefs, experiences and perspectives.
In an organization, this information is often embedded in your HR and talent data and can refer to gender, race, ethnicity, sexual orientation, education, socio-economic situation, experience, skills, certifications, geographical location and more.
This data is sometimes found in your core systems, like your HRIS or your learning management system, other times it’s found in surveys or qualitative data.
To be informative and actionable, this information has to come together into one, unified data set, which is very complex to do. Once you have access to the data, and it is being constantly fed and updated, you can develop a better understanding of how you are delivering on your diversity, equity, and inclusion goals.
Equity
Equity involves looking at programs, initiatives and individual cases where opportunities may or may not be consistent and fair.
This can be characterized by inequities or gaps in pay, promotions, opportunities for development, opportunities to lead, and more.
It also includes an articulation of who holds the decision-making power – and whether that’s representative of your cultural values, your community, your customers, and who you want to be.
Equity involves looking at all processes in your business – from hiring, firing, promotions, task assignment, team creation, recognition to other less obvious aspects like how meetings are run and how groups interact. It looks at these processes for bias or inequity – either conscious or unconscious.
Inclusion
While diversity is about differences, inclusion is about embracing those differences. Inclusion is the deliberate action aimed at creating a workplace culture where all differences are welcomed, accepted and appreciated. It’s about creating an environment where people feel valued, leveraged and welcome. In an inclusive organization all people are respected and appreciated for their unique contributions. You can spend hundreds of thousands or millions even on building a diverse workforce, but if you don’t invest in the inclusion piece, you’re missing out.
Information about inclusiveness tends to be driven by experience data and surveys which can be purely qualitative in nature but can also exist in a hybrid where qualitative and quantitative data are combined.
While diversity tends to be objectively assessed (how many, where), inclusion is more qualitative in nature. Inclusion is about the lived experience of people and groups within your organization. It involves asking questions and observing people and processes with a critical lens. It’s about experience, perceptions and feelings, and it’s necessary in order to create the right environment.
The Result – Belonging
When diversity, equity, and inclusion are combined it creates a workforce with a sense of belonging. Belonging is the human emotional need to be an accepted member of a group. Belonging is part of our inherent desire to be part of something greater than ourselves.
Why is belonging important?
We are social creatures and we’re driven by a need to belong. This need to belong has its roots in our evolution. Think of our hunter-gatherer ancestors. There were obvious advantages to belonging to a group – hunting, gathering, building shelter, protection, procreation. In fact, for our ancestors, not belonging to a group or being ostracized was usually a death sentence. This direct connection between group belonging and survival resulted in a strong psychological need to belong.
While today our environments don’t demand belonging as a key to physical survival, we are still wired for connection and belonging. Belonging makes us feel safe and connected. Studies show that belonging to social groups and/or having close relationships with people, makes us happier and healthier. Belonging has been shown to reduce stress, anxiety and depression. It is associated with lower rates of sickness and disease, lower levels of drug, alcohol and tobacco use, and higher levels of physical activity. Belonging has also been linked to increased performance among students and employees. And, in some cases, a real feeling of belonging and attachment to co-workers has been shown to be a stronger motivator than money.
Even more, the benefits of belonging extend beyond the individual to the health and well-being of the workplace. People who feel they belong are more likely to participate and become engaged in their work and work activities, and have better health outcomes. People who feel they belong are also more likely to donate their time and energy to improving the workplace and helping those around them.
All of this points to an imperative to strive for belonging in the workplace. Especially in today’s world where we spend more time at work than at home or any other place, fostering a true sense of belonging can have huge payoffs. At the individual level, a sense of workplace belonging can contribute to your employees’ mental and physical health, and it can make for happier people. Not only does this benefit the company in terms of reduced absenteeism, increased engagement, higher productivity, and a company culture that attracts top and like-minded candidates, it benefits the larger community through a ripple effect.
Diversity, Equity and Inclusion Analytics: Business Benefits
When diversity, equity and inclusion come together there are numerous benefits to the business. Some of these include:
Representation and Reputation
Building a company where equity is a core value and whose diversity is representative of the communities we live in is a logical, moral decision and can help with your organization’s reputation at-large.
Culture: Customer Alignment
To extend upon community alignment, building a company that is representative of your customer base is also beneficial and can help you deliver better products, branding and pitches.
While these “benefits” might make the argument easier to invest in DE&I, the bottom line, however, is that the decision for focusing on Diversity, Equity and Inclusion should be because it is the right thing to do, not because there’s a business case.
Belonging
A sense of belonging creates a positive culture that yields results for the individual employees, teams, and the overall organization. This can be quantified by a commitment to the organization, increasing net promoter score and total lifetime value of an employee.
Talent Attraction and Retention
Simply put, diversity begets diversity. With equitable HR programs and diverse talent attraction channels, your employer brand will be the flywheel to create the outcomes you are looking for when it comes to organizational demographics and retention.
Financial Performance
Last on the list, but the key to sustainability, well-being, employment opportunities and community investment, diverse companies deliver positive economic impact in the form of wages to underrepresented groups and taxes to all levels of government.
Where does your company stand?
Big Data and Analytics
When it comes to DE&I, many organizations struggle with transparency driven by a lack of access to data and the facts.
How can HR find the data they need to make important DE&I decisions?
Your HR data is everywhere and there is a lot of it. HR data lives in different formats, different languages, different technologies.
HR data is like an iceberg and below the surface is where the real value is and where meaningful results are delivered for the business.
There is one level of data – above the surface – that is visible, easy to access, and relatively easy to report. This is what we consider foundational HR metrics and standard reporting. These tend to be single dimension reports focused on top-line metrics using data pulled from your independent HR and talent systems. They also tend to lack the ability to deeply segment these metrics across the many lenses which are important to you.
Below the surface is where we find the more actionable, powerful and business relevant analytics. It is here, below the surface, where disconnected data can be brought together – past, present and future, and across people, talent and business sources.
This analysis is multi-dimensional, and enables you to understand all aspects of your workforce demographics, HR programs and employee experience and from the diversity, equity and inclusion lenses.
Today, almost all companies can point to some level of activity or investment they are making in the realm of diversity, equity and inclusion, however, few are able to accurately and consistently measure and analyze what’s really going on deep inside their organizations. In our experience, most are only scratching the surface in terms of being able to access, understand, and act upon diversity, equity and inclusion within their organizations.
Diversity, Equity, and Inclusion Analytics: The Basics
At the most basic level, diversity, equity and inclusion metrics provide a baseline understanding of how the organization is performing. These measures also tell you how you are doing in terms of compliance with regulations and against your own programs. An analytics-based approach makes it easy to deeply segment your data, represent that data visually and share information about areas of success and areas of opportunity across the organization in a compelling way.
At this level, it’s mostly about reporting aggregate rates and raw counts across larger, more generic audiences, which is enabled through your separate systems.
This may involve spending time analyzing and reporting on each of your HR systems (i.e. HRIS, learning management, talent management, recruiting, etc.), independently.
This is a good starting point. You can determine:
- Recruitment candidates by self-identified ethnicity
- Organizational unit demographics by age
- Organizational unit demographics by gender
- Organizational unit demographics by ethnicity
- Promotion counts and rates by age, gender or ethnicity
- Executive counts and rates across Under Represented Groups
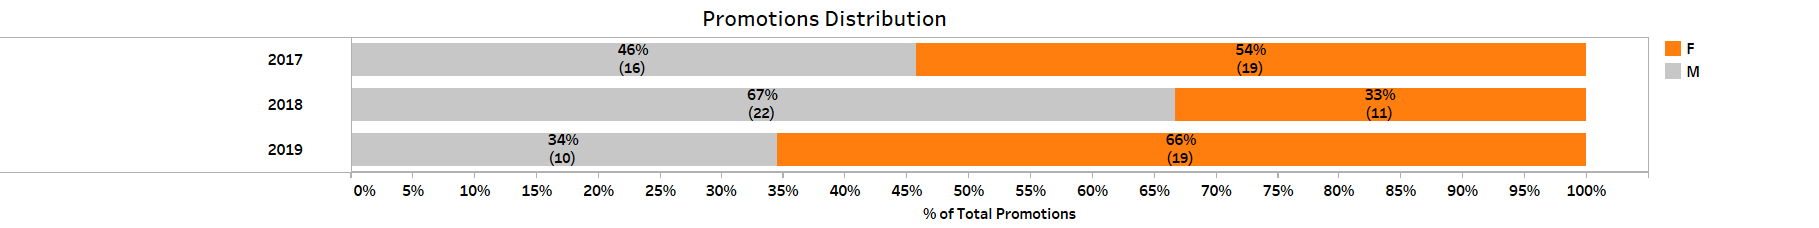
Promotions Distribution. Male vs Female. Rates and Counts. Last 3 years.
Diversity, Equity, and Inclusion Analytics: Beyond the Basics
To make any true strides in areas of diversity, equity and inclusion, it’s important to go beyond the foundational metrics and create actionable insight.
This involves looking at the entire employee lifecycle and looking at factual data, in addition to experience and context. It involves a unified data set that brings together your disparate systems.
This is where you need to bring together data from your different systems (HRIS, learning management, talent management, recruiting) as well as your survey and other contextual data in order to start to build a comprehensive and connected picture.
DE&I analytics may involve combining demographic data with performance, learning and compensation data. It may involve combining all of this with survey data, interviews, and/or program outcomes. It may involve a deep dive into hiring and recruitment data alongside turnover to uncover biases or gaps in process.
At this level, questions that can be addressed span the employee lifecycle and include:
Are we attracting and hiring diverse talent?
- Applicant counts and stage-by-stage (funnel) conversion rates by underrepresented group (URG)
- New hires by URG segmented across each job level, each job category, etc.
- Recruitment source success by URG
- URG hire rate (or possibly a customized Hiring Bias Index) by Hiring Manager gender, ethnicity, sexual orientation/identity, age, etc.
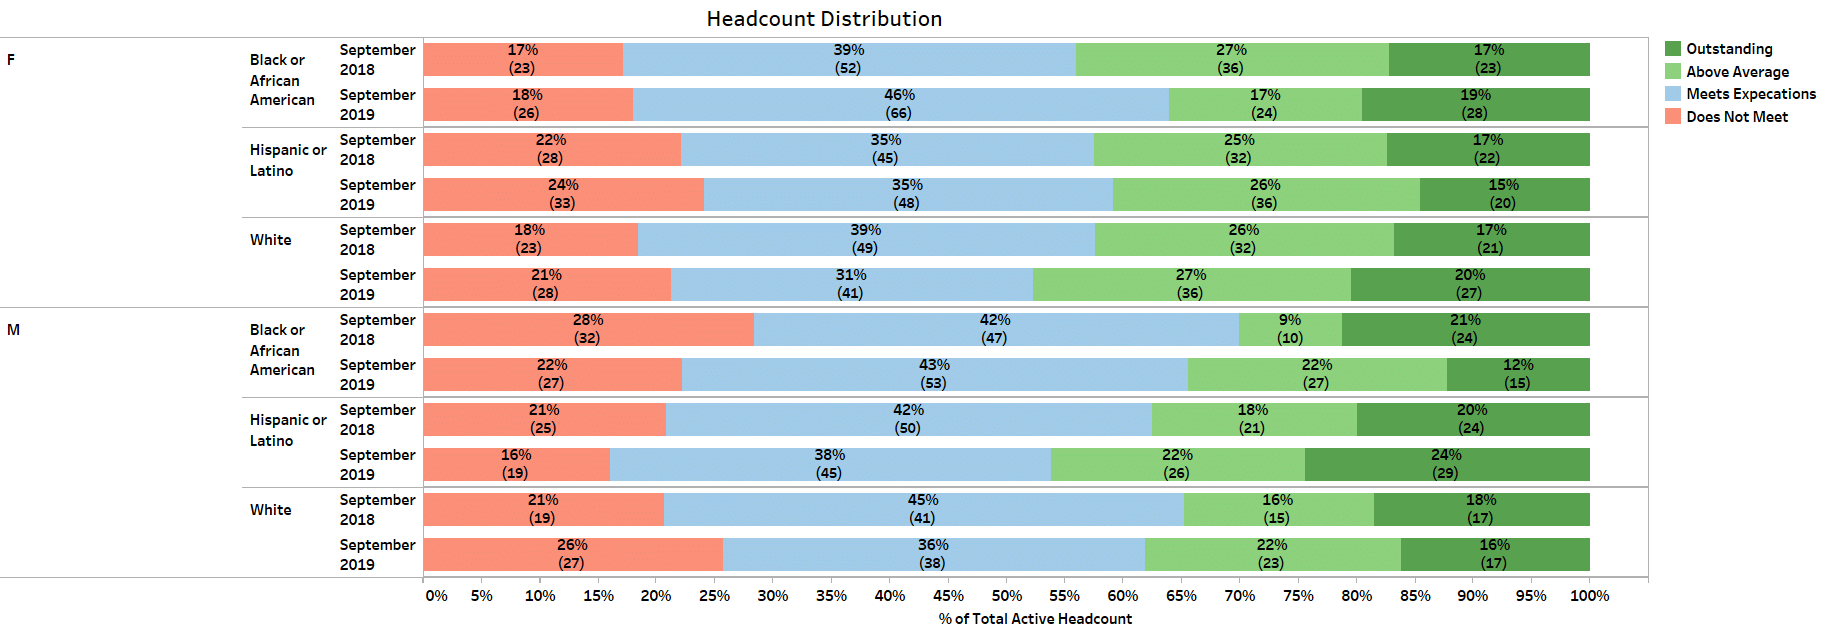
Headcount Distribution. By Gender then Ethnicity, then by Performance Rating. Rates and Counts. Last 2 Years
Are our compensation and promoting processes equitable?
- Compa-ratio by URG, then analyzed by department, role, etc.
- Promotion rate by URG, then analyzed by performance (i.e., 9 box, quota attainment, etc.) and compa-ratio
- What is your Equal Pay Day for URGs?
Are we developing and providing opportunities equitably?
- HiPos across URGs, by business unit, by role, by geography
- Learning, training and career opportunities across URGs, by performance, interest, skills, career stage, etc.
Are we retaining our talent?
- Talent turnover by URG tenure, learning, manager, department, role, etc.
- Compare retention rates vs comparable benchmarks
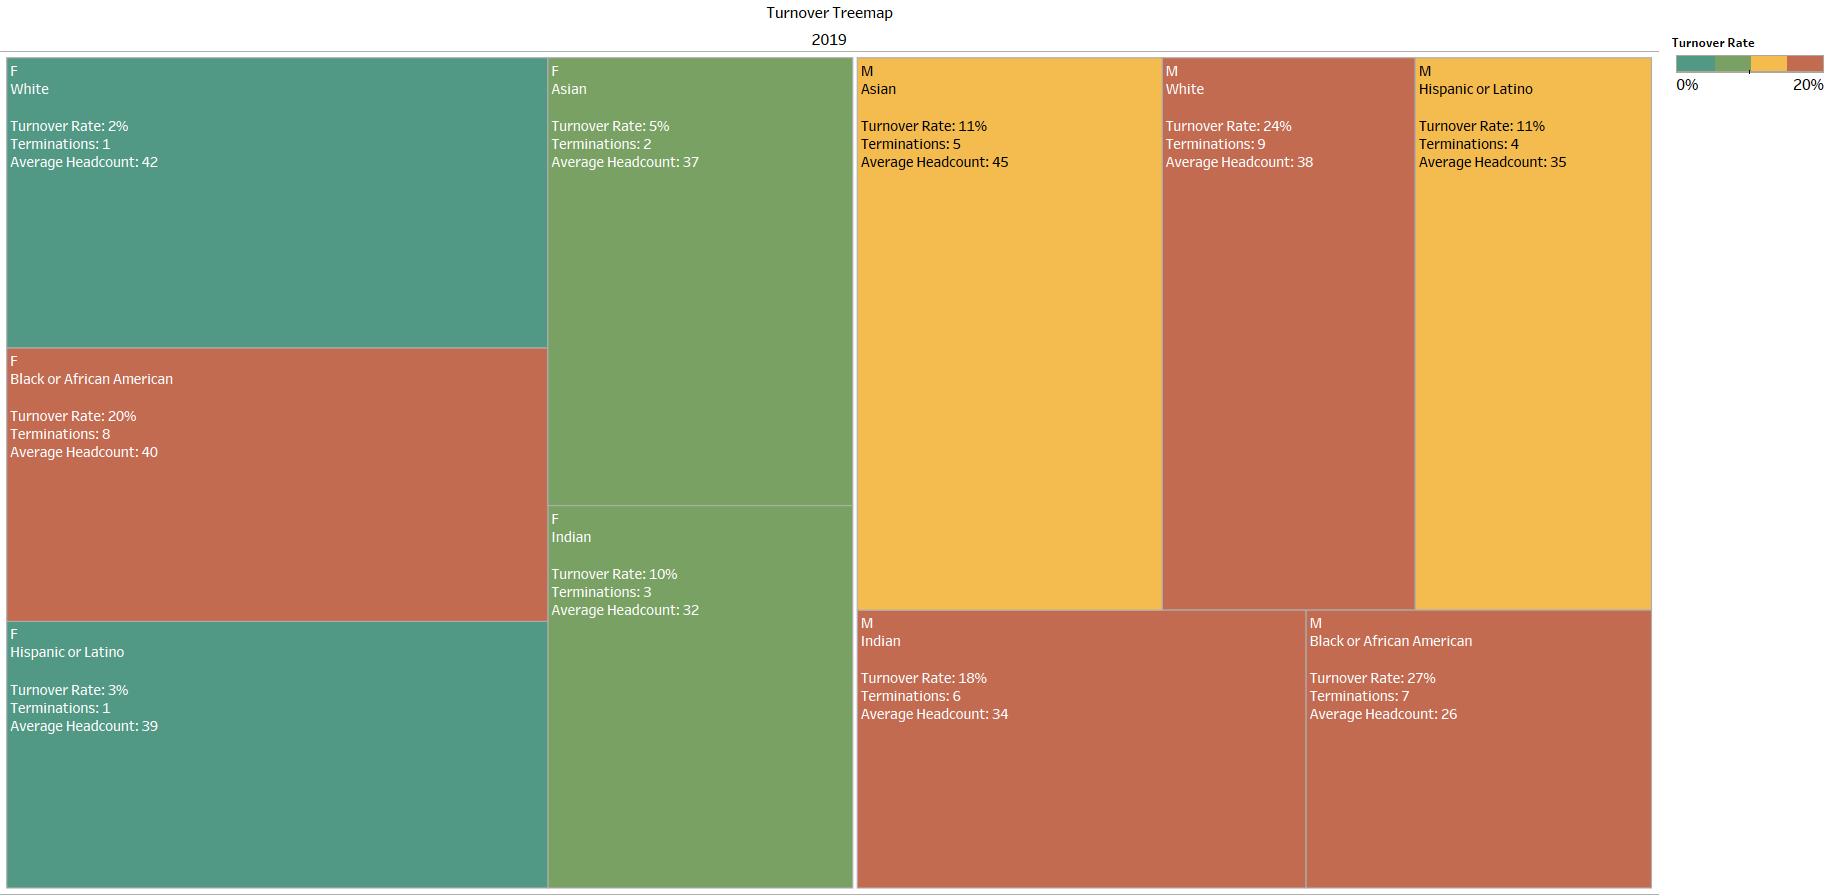
Turnover Tree map. Turnover by Gender and Ethnicity. Operations Department. Employees within their First 3 Years Tenure. Red/Yellow/Green Traffic Lights based on Custom Set Thresholds.
Are we prepared for the future with diverse talent? (Succession Planning)
- % of ready-now workers from URGs in pipelines for critical roles
- % of future-ready workers from URGs in pipeline for critical roles
Are we building an inclusive culture? How, who benefits and how effective are we at this?
- Are there opportunities for employees in their early parenting years? Military veterans or reserves? Those caring for elders and others in need?
- Are URGs feeling valued, heard, impactful in their roles? How does that compare to your larger workforce populations?
- Are your programs effectively driving engagement and inclusion with work from home audiences?
What’s exciting is that the permutations are almost endless and this translates to the right organizations truly working towards making a difference in people’s lives, the communities they spend time in, and for their organizational culture.
You’ll see in an example below that the ability to connect recruitment, hiring, retention, and turnover data to demographics helped one customer identify a gap (high turnover among females in a given position) and introduce targeted actions to mitigate this across the areas of recruitment, hiring and retention.
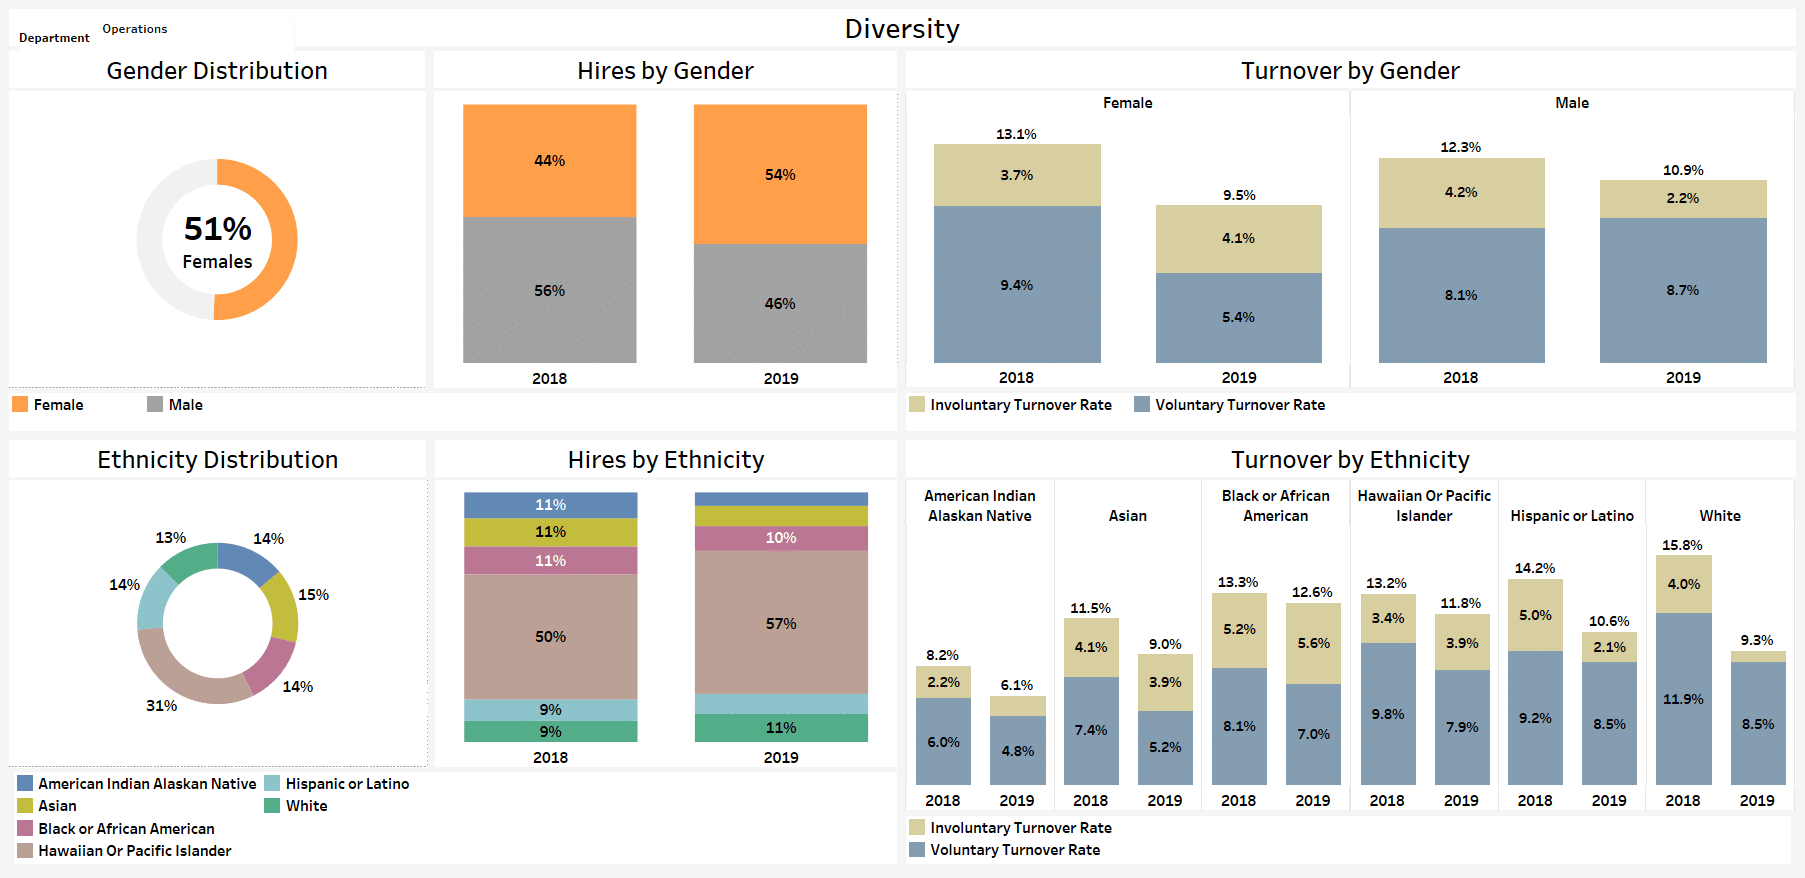
Diversity Dashboard. Headcount, Hires & Turnover by Gender and Ethnicity. Operations Department. Last 2 Years.
In some cases, however, you may need more than the data on hand.
You may need to gather contextual data, via interviews or focus groups, or other forms of qualitative inquiry. As Maxine Williams, Chief Diversity and Inclusion Officer of Facebook notes, you can’t just say “if there were more of you, we could tell you why there were so few of you,” you need to find alternative ways of understanding. Using qualitative research methods to connect with employees is always a good idea. Qualitative insight gives voice to employees and adds context and nuance to what the data is telling you. A qualitative narrative can also help when communicating the DE&I story in a compelling way.
Diversity, Equity, and Inclusion in Action: Mattamy Homes
Mattamy Homes is recognized as North America’s largest privately owned home builder. Kerri Smiley, SVP of Human Resources is using people analytics to advance her DE&I programs within the organization.
“Within HireRoad, we were able to drill down into key metrics and look at promotion and attraction rates of males vs. females and identify a turnover issue among millennial, high-performing females. Armed with this insight we were able to demonstrate our need for the ‘WiN at Mattamy’ program.”
Partnering with HireRoad has helped advance the DE&I activities at Mattamy Homes in two key ways:
- Having an analytics partner has freed up time previously spent on analytics and reporting, and enabled the HR team to turn its attention to other high value areas, including DE&I. Kerri describes moving from manual, in-house reporting tasks to having a comprehensive people analytics platform which enables reporting 100x faster, and “1000x better”. This freeing up of time and resources has led to the HR team being able to focus on business relevant questions and providing metrics and dashboards the business needs.
- One initiative that is a source of pride for Kerri and Mattamy as a whole is the newly launched “WiN at Mattamy” program, aimed at developing young women within the organization. With their HR and talent data available in HireRoad, Kerri was able to build the business case for this program. Within HireRoad, Kerri’s team was able to drill down into key metrics and look at promotion and attraction rates of males vs. females and identify a turnover issue among millennial, high-performing females. Armed with this insight they were able to demonstrate the need for the “WiN at Mattamy” program.
The ability to constantly refresh DEI dashboards makes it easy to measure progress in an ongoing fashion, and to tell the story to leadership.
Conclusion
The research – and our direct experience with our customers – makes it clear: there isn’t an area of business that diversity, equity and inclusion does not affect. A focus on improving diversity, equity and inclusion can yield positive results across recruitment, retention, reputation, and business performance. It leads to happier, healthier and more productive employees. When employees feel a sense of belonging at work, they are more likely to participate and become engaged in their work and work activities. They are also more likely to donate their time and energy to improving the workplace and helping those around them. This culture of belonging can ripple out to our homes and communities in a positive way.
Making progress with diversity, equity and inclusion is not easy but it starts with an analytics-based approach. Foundationally, you need access to the data to know where you are on diversity, equity and inclusion. Once you have access to the data you can begin to identify gaps and areas of opportunity across the organization. Building a deeper DE&I analytics capability is essential. This involves the ability to make connections across your data and systems. It may involve combining demographic data with performance, learning and compensation data, or combining all of this with survey data, interviews, and/or program outcomes. It may involve a deep dive into hiring and recruitment data alongside turnover to uncover biases or gaps in process. While this may sound complex – and to some degree it is – it is definitely worth the effort. As discussed, diversity, equity and inclusion improvements will reap benefits across the organization.
All of this is to say that we believe efforts to improve diversity, equity and inclusion are not only good for business, but represent an area where HR – with the right analytics and insight guiding decisions and actions – can truly make a difference both within our companies and throughout our communities. Learn more about our products.